SWE can detect myocardial remodelling in aortic stenosis patients undergoing aortic valve replacement
European Heart Journal


Abstract
Aortic stenosis (AS) progresses over time with the development of diffuse and eventually replacement fibrosis. Extensive fibrosis is associated with a worse outcome after aortic valve replacement (AVR). Therefore, early markers of LV deterioration are needed to optimize AVR timing. Cardiac shear wave elastography (SWE) can non-invasively assess myocardial stiffness via the detection of shear waves (SW) after e.g. mitral valve closure (MVC). The speed of these waves is directly related to myocardial stiffness and SW speed (SWS) has shown to correlate with markers of fibrosis, such as T1 mapping in other study populations.
To investigate whether SWE is related to fibrosis and other markers of myocardial remodelling in AS patients undergoing transcatheter or surgical AVR (TAVI or SAVR) and how findings change post-operatively.
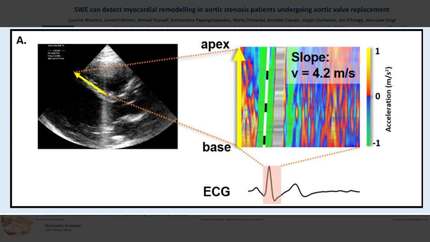
30 AS patients undergoing TAVI (n=16) or SAVR (n=14) were included and 14 age-matched healthy volunteers (HV) served as controls. SWE and conventional echocardiography were performed before TAVI or SAVR and repeated after 1 year. For SWE, images were acquired at a high frame rate (1032±125 fps). SW after MVC were visualized in M-modes of the septum, colour coded for tissue acceleration. The slope of these bands represent SWS (Fig 1A). A subset of 12 AS patients underwent cardiac MRI before AVR and T1 mapping served as indicator of myocardial fibrosis.
Patient characteristics are described in Table 1. LV mass significantly decreased 1 year after TAVI/SAVR (138±31 vs 117±29 g/m²; p<0.001), indicating reverse remodelling. We observed a non-significant decrease in SWS 1 year after TAVI/SAVR (5.9±1.5 vs 5.5±1.3 m/s; p=0.10; Fig 1B). SWS in HV was lower compared to AS patients at baseline (5.9±1.5 vs 4.9±1.0 m/s; p=0.02; Fig 1B), while 1 year after TAVI/SAVR SWS there was no difference any more (5.5±1.3 vs 4.9±1.0 m/s; p=0.11; Fig 1B), indicating that SWS normalized over time. More importantly, SWS at baseline correlated with MRI T1 mapping values (r=0.626, p=0.030; Fig 1C), implying that SWS could be a maker of fibrosis in AS patients. SWS was also linked to the extent of remodelling, as shown by the significant correlation between SWS and indexed LV mass at baseline (r=0.494, p=0.006; Fig 1E) and 1 year after TAVI/SAVR (r=0.415, p=0.022; Fig 1F). Univariate predictors of LV mass 1 year after TAVI/SAVR were (all measured at baseline): systolic blood pressure (SBP), LV mass, LA volume index (LAVI), ejection fraction and SWS. In the multivariate model (adjusted R²= 0.814), SWS remained a strong predictor alongside SBP, LV mass, LAVI and the pressure gradient across the aortic valve (Fig 1D).
SWS correlated with T1 mapping values and LV mass at baseline and 1 year after AVR. This indicates that in AS patients, SWS is linked to markers of LV reverse remodelling after AVR. To which extent SWS predicts outcome remains to be investigated in a larger study with longer follow up.
Contributors


You may be interested in