Timing of natural shear waves after mitral valve closure in a pressure-volume loop analysis
European Heart Journal


Abstract
Cardiac shear wave (SW) elastography uses the propagation speed of natural SWs after mitral valve closure (MVC) to assess left ventricular (LV) diastolic function properties, i.e. intrinsic myocardial stiffness and LV filling pressures. However, these SWs are only induced at end-diastole (ED), but propagate thereafter, during isovolumic contraction (IVC), when the myocardium starts to actively stiffen due to contraction.
This study aimed to investigate the timing of SW under different loading conditions and after myocardial injury, as well as if and how SW speed is influenced by this.
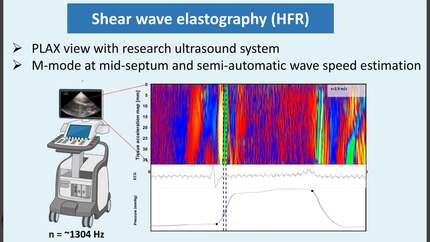
12 pigs underwent sequential interventions to alter their loading and intrinsic myocardial properties (Figure 1, upper panel): (1) baseline, (2) preload decrease, (3) afterload increase, (4) preload increase, (5) ischemia/reperfusion (I/R) injury, after transient occlusion of the left anterior descending artery, and (6) preload decrease after I/R. PV loops were recorded at all conditions (Figure 1A). In parallel, high frame rate (HFR) imaging was performed in a PLAX view with a research ultrasound scanner (~1304 Hz) (Figure 1B). An M-mode line was drawn in the middle of the septum and tissue acceleration (TA) maps were created, to visualize the SWs after MVC. We investigated the first negative deflection of the SW in the acceleration map. Their speed was semi-automatically calculated by measuring the spatiotemporal slope of the peak TA (Figure 1C-upper panel). The PV and HFR data were temporally aligned by cross-correlating their respective ECGs (Figure 1C). The same M-mode was used to manually indicate the start and end time of the SW, giving access to the time delay with respect to ED and the instantaneous pressures (P1, P2). The average of P1 and P2 represented the mean pressure (Pm) during SW propagation (Figure 1A). Pearson’s correlation and regression analysis were performed.
The first negative deflection of the SWs after MVC occurred on average 35±10 ms after ED (thicker segments in the pressure curves in Figures 2A and 2B); there was no significant difference in timing among the different experimental conditions. The change in SW speed relative to baseline correlated with the change in end-diastolic pressure (EDP) for both the different loading conditions (r = 0.6, p < 0.001) (Figure 2C) and after I/R injury (r = 0.5, p = 0.017) (Figure 2D). In a multilinear regression model that included the stiffness constant β, EDP, Pm and preload recruitable stroke work (PRSW), only β (β coefficient=21.5, p<0.001), followed by EDP (β coefficient=0.8, p=0.032), independently predicted SW speed.
Our results show that the timing of SW after MVC is relatively stable under different loading conditions and after I/R injury. Shear wave speed, even though measured during early IVC, is mainly related to ED myocardial stiffness and filling pressures.
Contributors

You may be interested in