The two sides of the pericardial space - Omnipolar voltage and LAT differences on true epicardial vs. parietal pericardial surfaces during VT substrate mapping
EP Europace Journal


Abstract
Percutaneous epicardial mapping for ventricular tachycardia ablation is increasingly performed. During epicardial mapping, acquired EGM points are projected onto the closest surface of the 3D geometry of the pericardia space, either epi- or (parietal) pericardially. Epicardial EGMs (E-EGM) are more likely to represent good electrode-tissue coupling, pericardially projected EGMs (P-EGM) poor catheter contact. In clinical procedures, maps are traditionally interpretated from the outer surface, i.e. parietal pericardium, whereas the surface of interest, i.e. true epicardium, is impractical to visualise and rarely reviewed (Fig.1).
Quantify LAT and omnipolar voltage (OV) differences between "pericardial" and true "epicardial" EGM points of ventricular substrate maps.
Epicardial substrate maps encompassing the entire RV and LV surface acquired during clinical VT ablation procedures were retrospectively reviewed. 15 predefined anatomical sites were marked on the outer (pericardial) surface of the geometry model: Anterior/lateral/inferior basal and midventricular points over both RV & LV, RV & LV apex and anterior RVOT. Subsequently, the map was reviewed from the inside and 15 corresponding markers placed on the inner (epicardial) surface opposing their respective pericardial marker. Internal point projection was set to 7mm. LAT (ms) and OV (mV) of E-EGMs and the spatially closest corresponding P-EGM at these sites were compared.
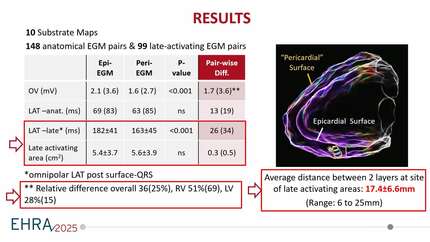
148 omnipolar EGM pairs on 10 epi/pericardial maps were assessed (8 RV paced, 2 Sinus). Average omnipolar voltage difference between EGM-P/ E was 1.7±3.8mV (p<0.001). Absolute voltage discrepancies were higher over LV segments (2.5±5.4mV) compared to RV (1.1±1.3mV). If adjusted relative to voltage amplitude of included EGMs, the average epicardial amplitude was 36±25% higher than the respective pericardial EGM, with larger relative changes over the RV (51±69%) than the LV (28±15%). Anatomical segments with the highest relative voltage discrepancies were lateral RV wall followed by RV apex. Average LAT difference of E/P-EGM pairs assessed at the 15 predefined anatomical sites was 13±19ms (p=0.369). Yet at sites with abnormal late potentials LAT difference could be >200ms due to "missed" late potentials on the pericardial surface (Fig.2).
Comparison of epi vs pericardially projected EGMs revealed a significant difference in omnipolar voltage with on average 36% higher voltages on the epicardial surface and overestimation of the extent of low voltage area on the pericardial map. LATs were not statistically significant different when assessed on an anatomical basis alone (including healthy areas). Yet, low amplitude late potentials can be missed and late activating area underestimated if only the outer surface is reviewed. Improved visualisation of the epicardial surface in clinical mapping systems is needed to prevent misinterpretation of the true epicardial substrate. Epicardial vs Parietal Pericardial Map Example of omnipolar LAT & Voltage Maps
Contributors

J B Tonko
Author
E Cabrera-Borrego
Author
P Sanchez-Millan
Author
J Jimenez-Jaimez
Author
A Chow
Author
P Lambiase
Author
You may be interested in