Deep learning quantification of hypermetabolism in cardiac sarcoidosis
European Heart Journal - Cardiovascular Imaging


Abstract
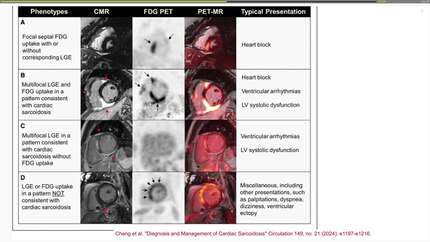
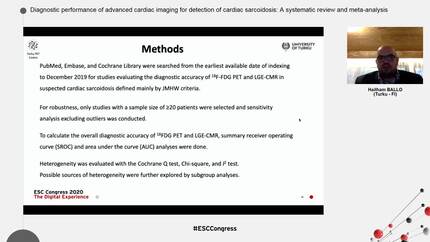
Cardiac sarcoidosis is an inflammatory cardiomyopathy characterized by non-caseating granuloma formation. Diagnosis of cardiac sarcoidosis can be challenging, but 18F-fluorodeoxyglucose (FDG) positron emission tomography (PET) imaging plays a critical role by identifying abnormal hypermetabolism in myocardium from inflammatory cells. Quantification of myocardial hypermetabolism plays an important role in diagnosis and risk stratification but currently is associated with observer variability due to subjective placement of regions of interests and varied uptake of the FDG in the myocardium. We evaluated a fully automated method for quantifying FDG PET activity using deep learning segmentation of the coregistered CT attenuation maps.
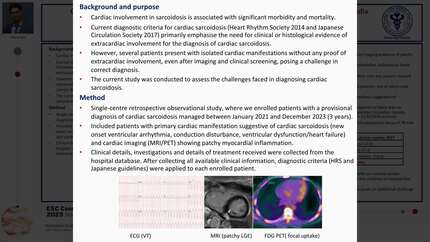
We identified 63 patients with suspected cardiac sarcoidosis who underwent FDG PET/CT, including only the first study for each patient. A foundational deep learning model was used to automatically segment all myocardial chambers and left ventricular myocardium from computed tomography (CT) attenuation imaging. Those segmentations were transferred to FDG PET images to automatically quantify maximal standardized uptake values (SUVmax) in myocardium, target to background (left atrium) ratio (TBR), volume of inflammation (VOI) and cardiometabolic activity (CMA) (Figure 1 A). We evaluated the diagnostic accuracy of these measures for cardiac sarcoidosis, with diagnosis based on Japanese Ministry of Health and Wellness criteria.
A total of 63 patients were included, with mean age 56.7 ± 13.5 and 39 (61.9%) male patients. Cardiac sarcoidosis was present in 24 (38.1%) patients. Fully automated quantification was performed in ~16 seconds per patient. Patients with cardiac sarcoidosis had higher median SUVmax (7.0 vs 4.3, p=0.001), TBR (2.7 vs 1.3, p<0.001), VOI (45 mL vs 1mL, p<0.001), and CMA (203 vs 0, p<0.001). VOI (0.910, 95% CI 0.841 – 0.979, p=0.016) and CMA (0.908, 95% CI 0.837 – 0.979, p=0.011) had significantly higher area under the receiver operating characteristic curve compared to SUVmax (0.740, 95% CI 0.599 – 0.882) (Figure 1B).
We demonstrate that fully automated quantification of FDG PET for cardiac sarcoidosis based on segmentation of CT attenuation maps is feasible, rapid, and has high diagnostic accuracy. This approach could be applied to provide objective and reproducible measurements of cardiac hypermetabolism to aid in diagnosis or follow response to therapy.
Contributors

R O B E R T Miller
Author
A N N A Michalowska
Author
H E L E N Struble
Author
E V A N Kransdorf
Author
M A R K Lemley
Author
P A U L Kavanagh
Author
J O A N N A Liang
Author

D A N I E L Berman
Author

You may be interested in