Myocardial blood flow values based on 15O-water PET are insensitive to image reconstruction settings
European Heart Journal - Cardiovascular Imaging


Abstract
Type of funding sources: None.
For 15O-water PET, a cutoff hyperemic myocardial blood flow (MBF) value of 2.3 mL/g/min for significant ischemia has been established (1). For other tracers, different studies show a wide range of proposed cutoff values. The use of uniform absolute cutoff values for pathological hyperemic MBF or flow reserve in clinical decision making requires robust quantification of MBF, with comparable values across scanners, centres, and reconstruction methods.
The aim of the present work was to assess the effect of different reconstruction methods on quantitative MBF values based on 15O-water PET.
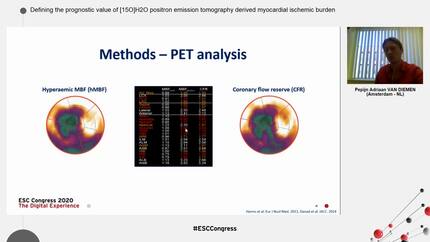
Whole left ventricle MBF values ranged from 1.1 to 3.9 mL/g/min. Visually, there were only small differences in MBF images or polar maps between methods (Figure 1). Correlation between whole left ventricle MBF values based on the various reconstruction algorithms was high (r > 0.99). At the regional level, correlation coefficients were always > 0.94 (Figure 2). No significant bias was found between any of the reconstruction methods and the standard method (p > 0.65). Regression slopes relative to the standard method ranged from 0.993 to 1.080. Changes in reconstruction settings did not alter diagnosis in any patient.
Changes in reconstruction settings such as filter size, number of iterations, inclusion of time-of-flight or resolution recovery, and regularization, have negligible impact on MBF values based on 15O-water PET analyzed using the automated software. This is likely due to the fact that MBF is determined by the clearance rate of 15O-water rather than its uptake rate such as for other PET tracers, in addition to the used segmentation routines. These results also indicate that quantitative MBF measurements using 15O-water are likely to be robust across different types of PET scanners and hospitals, which is highly important for reliable clinical use of cut-off values for ischemia.
Abstract Figure 1 - Polar maps
Abstract Figure 2 - Correlation between methods
Contributors

E Lindstrom
Author
D Dahlgren
Author
A Mehic
Author
J Sigfridsson
Author
T Kero
Author
J Sorensen
Author
HJ Harms
Author
M Lubberink
Author
You may be interested in