Proteomics to identify biological pathways and develop prediction models of coronary microvascular dysfunction in women with angina and no obstructive coronary artery disease
European Heart Journal


Abstract
Coronary microvascular dysfunction (CMD) is a major cause of angina and impaired outcome. Protein biomarkers could simplify patient selection for assessment and help uncover pathophysiologic pathways.
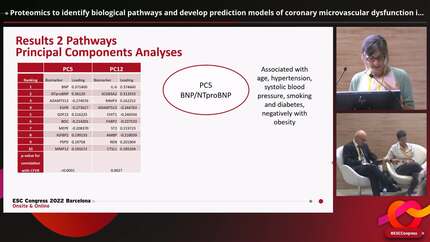
We quantified 184 protein biomarkers in 1471 women with angina and no obstructive coronary artery disease on angiography characterized for CMD by coronary flow velocity reserve (CFVR) by Doppler Echocardiography. Sixty-one biomarkers were significantly associated with CFVR (Figure 1). The strongest correlations were seen for renin, growth differentiation factor 15 (GDF15), brain natriuretic protein (BNP), NT-proBNP and adrenomedullin (ADM) (all p<1e-06). To identify pathophysiological patterns, we applied principal components (PC) analyses and weighted protein co-abundance network analyses. Two PCs with the highest loading on BNP/ NTproBNP and interleukin 6 (IL-6), respectively, were strongly associated with low CFVR. The weighted protein co-abundance network analyses identified two clusters associated with low CFVR reflecting involvement of hypertension/vascular function and immune modulation. For prediction of CMD (CFVR <2.25, n=646), data was split into model and validation cohorts. The best model using only clinical data had area under the receiver operating characteristic curve (ROC-AUC) of 0.61 (95% CI 0.56–0.66). ROC-AUC improved to 0.66 (95% CI: 0.62–0.71) with addition of biomarkers. Stringent two-layer cross-validated machine learning models had ROC-AUC ranging from 0.58 to 0.66 (Figure 2); the most predictive biomarkers were renin, BNP, NT-proBNP, GDF15 and ADM.
CMD was associated with biological pathways, particularly involving inflammation (IL-6), blood pressure (renin, ADM) and ventricular remodelling (BNP/NTproBNP). The identified biomarker pathways may prove potential treatment targets for CMD. Diagnostic models improved significantly when adding protein biomarkers to clinical information.
Type of funding sources: Private grant(s) and/or Sponsorship. Main funding source(s): Danish Heart Foundation
Figure 1. The Volcano plot depicts correlations between 184 biomarkers and coronary flow velocity reserve (CFVR). Sixty-one biomarkers significantly associated with CFVR (p<0.05) are depicted in blue – on the left are negative correlations, on the right positive correlations.
Figure 2. Ranking of the 10 most important variables and model performance metrics for each of the machine learning algorithms. AUC, area under the curve; NPV, negative predictive value; PPV, positive predictive value.
Contributors

E Prescott
Author
K Bove
Author
H E Suhrs
Author
D F Bechsgaard
Author
T Lange
Author
J Schroder
Author
R L Nielsen
Author
You may be interested in