Novel contrast-computed tomography method based on a Gaussian Mixture Model for assessment of fibrocalcific volume in aortic valve stenosis
European Heart Journal


Abstract
Discordant echocardiography is observed in up to one third of patients with aortic stenosis (AS), in whom computed tomography (CT) derived aortic valve calcium scoring is now recommended. However, CT calcium scoring only assesses calcific valve thickening and ignores non-calcific fibrotic thickening, which could be an important contributor of AS.
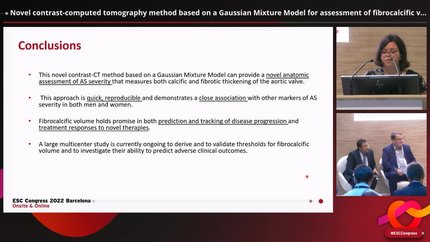
To generate a quick and robust contrast-CT method based on a gaussian mixture model (GMM) for assessment of fibro-calcific aortic valve thickening in patients with AS, and to investigate its reproducibility and associations with echo parameters of AS severity and disease progression.
A post-hoc analysis of 136 patients with calcific AS (24 with severe, 81 moderate and 31 mild AS) enrolled in the SALTIRE2 trial (NCT-02132026) was performed. Aortic valve fibrocalcific volume was calculated using a GMM applied on contrast-CT at baseline and at 1-year follow up. The software estimated the Hounsfield Units (HU) distribution of 3 compartments (blood pool, non-calcific and calcific tissue) within the aortic valve volume of interest, automatically generating thresholds for non-calcific and calcific tissue, respectively computed as the lower 99.7 and the upper 99.7 percentile of the blood pool HU distribution (Figure 1). Fibrocalcific volume was measured as the sum of calcific and non-calcific volumes, indexed for CT annulus area and compared to echo parameters of AS severity. Evaluation of scan-rescan reproducibility and AS progression were also assessed.
Image analysis took 5.8±1.0 minutes per scan and showed excellent scan-rescan reproducibility (mean difference −1%, limits of agreement −9% to 7%). Indexed-fibrocalcific volume correlated well with echocardiographic aortic peak velocity (rho=0.70, p<0.0001), better than non-calcific and calcific volumes alone (rho=0.30 and rho=0.61 respectively, both p<0.0001) and Agatston calcium score (rho=0.63, p<0.0001). Baseline indexed-fibrocalcific volume was also the strongest predictor of subsequent AS progression in terms of change in aortic valve peak velocity (rho=0.29, p=0.006) and mean gradient (rho=0.39, p<0.0001). Progression-to-noise ratio for fibrocalcific volume was favourable (Cohen's statistic d=0.62), indicating that groups sizes of 21, 46 and 170 participants would be required to demonstrate 30%, 20% and 10% reductions in fibro-calcific volume progression with a novel drug respectively (alpha=0.05, power=80%).
This novel contrast CT-based approach can provide robust and rapid assessment of fibrocalcific thickening in AS patients. Fibrocalcific volume measured using this technique, correlates well with other markers of AS severity, predicts disease progression and holds promise in tracking disease progression and response to novel therapies.
Type of funding sources: None.
Figure 1
Contributors

M Lembo
Author
S S Joshi
Author
L Carnevale
Author
R Bing
Author
E Tzolos
Author
A K Barton
Author
J Geers
Author
T A Pawade
Author
M K Doris
Author
D E Newby
Author
D Dey
Author
M R Dweck
Author
You may be interested in